This article explores the idea that changes in the market implied duration are driven by the Fundamental Evolution. Observable changes in company fundamentals may provide early signals of structural changes in market-implied duration of tech stocks.
Duration can be understood as the weighted average arrival time of expected future cash flows, or equivalently, the sensitivity of an asset’s price to changes in the discount rate. As expected cash flows are realised and move closer in time, duration shortens.
If we apply this analogy to tech stocks, how does equity duration evolve as a company matures? More specifically, how does the market’s perception of future cash flows change as previously expected cash flows become realised?
This article begins with a simple empirical question: how has the interest-rate sensitivity of tech stocks evolved over time? Rather than attempting to estimate the theoretical duration implied by discounted cash flow models, we start with observed market pricing to construct what I refer to as market-implied duration.
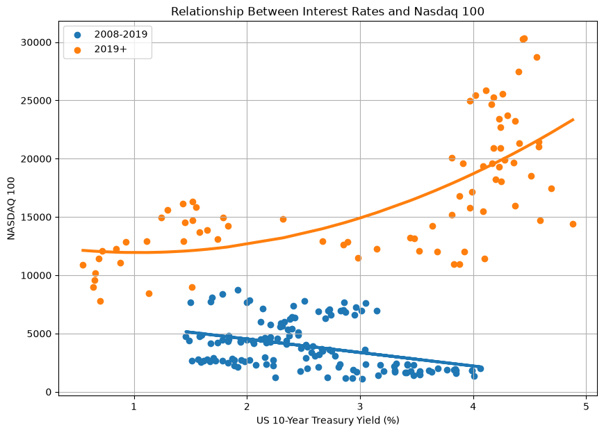
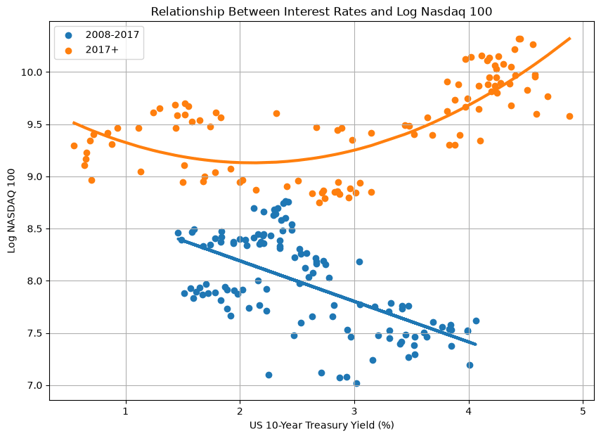
Prior to 2017, the relationship between technology stocks (proxied by the Nasdaq 100) and interest rates (proxied by the US 10-year Treasury yield) broadly followed conventional discounting intuition: higher yields were associated with lower stock prices. However, after 2017, the empirical relationship changed. Rather than remaining approximately linear, the price–yield relationship became distinctly nonlinear, with evidence of positive convexity.
This observation can be demonstrated by a Chow test across a range of candidate break dates. For the Nasdaq 100 price level, the Chow statistic reaches its maximum in 2019 (Chart 1), while for the logarithm of the Nasdaq 100 it peaks in 2017 (chart 2). The logarithmic specification reduces the exponential growth embedded in long term equity prices.
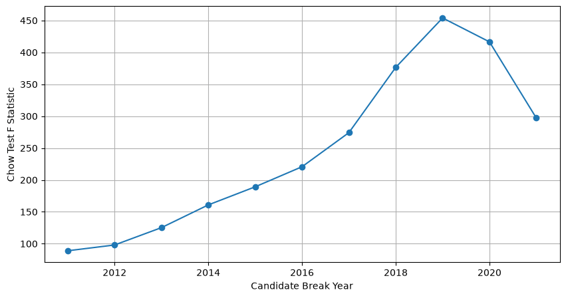
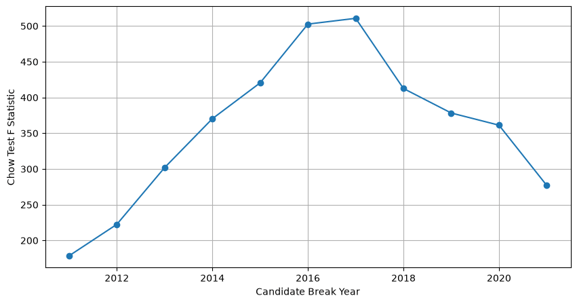
Chart 3 and Chart 4 present a linear regression before the identified structural break and a quadratic regression thereafter. The evidence suggests that the relationship between technology stock prices and interest rates is not stable through time. Rather than assuming a constant market-implied duration, the empirical results point to a structural change in the price–yield relationship.
But here is where things become interesting. What if the convexity is not purely driven by interest rates? What if time itself is capturing something more fundamental about the evolution of tech sector? To find out, we estimate the quadratic specification with and without a deterministic time trend. The results (Table 1) show that much of the estimated convexity (Beta2) diminishes once the time trend is included, although a statistically significant nonlinear relationship remains.

So what does the time trend represent?
Introducing a time trend substantially reduces the estimated curvature between prices and discount rates. We interpret this as being consistent with the view that time trend acts as a statistical proxy for the long-run evolution of the technology sector. Over time, technology companies experienced structural improvements in their cashflow profile, business quality, growth expectation and capital allocation. Collectively, we refer to these secular changes as Fundamental Evolution.
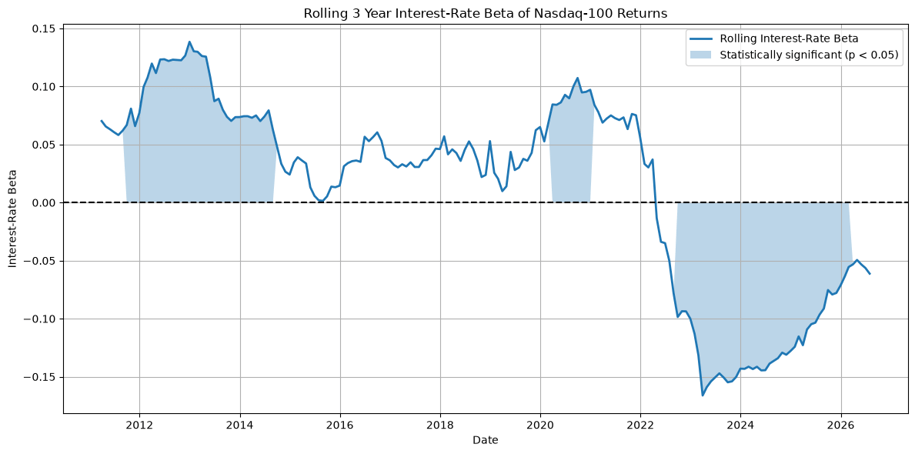
Next, we estimate a rolling 3 year interest-rate beta of Nasdaq 100 returns, with the shaded regions indicating periods in which the estimated beta is statistically significant (Chart 5). The results demonstrate that the realised sensitivity of Nasdaq 100 returns to interest-rate shocks has evolved over time. Early positive estimates are statistically significant over several windows before gradually weakening towards zero. Around 2022, the relationship shifts markedly. From approximately 2023 onwards, the interest-rate beta becomes persistently negative and statistically significant, suggesting that technology returns have become increasingly sensitive to changes in discount rates.
The evidence presented so far points to two distinct observations. First, the long-run relationship between technology prices and interest-rate levels experienced a structural break around 2017. Second, the short-run sensitivity of returns to interest-rate shocks changed materially following the 2022 tightening cycle.
So what’s actually changing? Can both observations originate from the evolution of a firm’s expected cash-flow profile? If the observed interest-rate sensitivity reflects an underlying, but unobservable, fundamental duration, can observable changes in company fundamentals help explain the evolution of this market-implied duration?
To investigate this hypothesis, we turn to a single-company case study: NVIDIA.
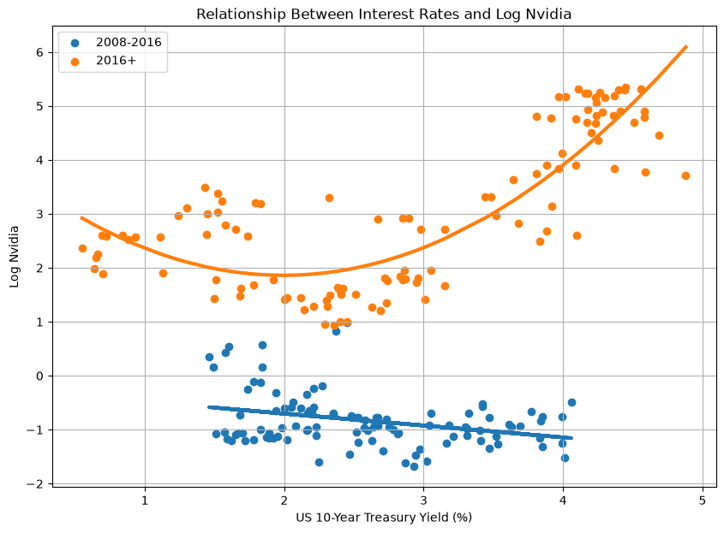
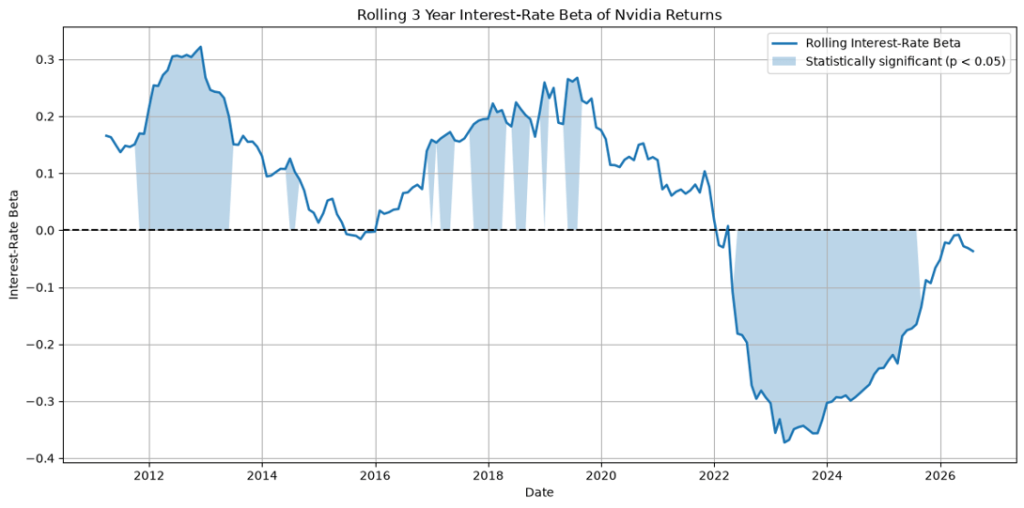
Repeating the same empirical framework, the Chow test identifies the end of 2016 as the most likely structural break in the relationship between NVIDIA’s log price and the US 10-year Treasury yield. Similar to the Nasdaq 100, the relationship is approximately linear before the break but becomes distinctly nonlinear afterwards (Chart 6). Furthermore, NVIDIA’s rolling interest-rate beta also becomes increasingly negative following the 2022 tightening cycle, although with a larger magnitude than that observed for the Nasdaqn100.
This naturally leads to the central question of the article. As technology companies mature, previously expected cash flows are gradually realised, suggesting that their effective duration should decline. However, technological innovation may simultaneously generate new long-term growth opportunities, extending the expected cash-flow profile. NVIDIA provides a compelling case study. Its current expected cash-flow profile differs fundamentally from that of a decade ago, implying that investor expectations have also evolved dramatically.
So where do we go from here? Can a basket of observable fundamental indicators, including measures of cash-flow profile, business quality, growth expectation and capital allocation, provide leading signals for the emergence of market-implied duration? More specifically, which observable changes in a technology company’s fundamentals consistently precede structural changes in its price–yield relationship and its interest-rate sensitivity?
Volume II will explore this idea by constructing a framework across a basket of technology companies, with the objective of identifying leading indicators of market-implied duration and examining whether changes in company fundamentals leave observable footprints before market-implied duration begins to evolve.
 Photon Research
Leave a comment