Anthea Xie
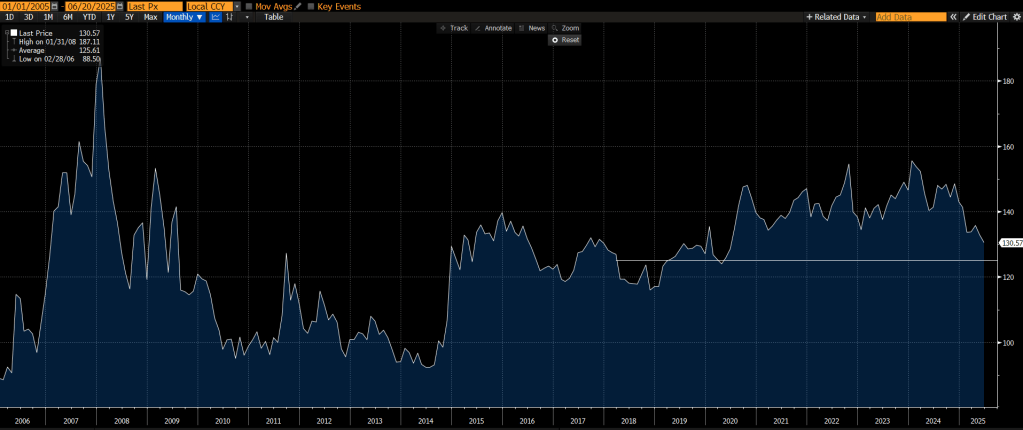
The AH share premium represents the price difference between A-shares (listed on the Shanghai or Shenzhen stock exchanges) and H-shares (listed in Hong Kong) of dual-listed Chinese companies. Recently, the Hang Seng Stock Connect China AH Premium Index fell to around 130—its lowest level since 2020 and close to the long-term average of 125. The index reached a peak of 187.11 in 2008 but has since declined and generally stabilized within the 120–150 range.
This reminds me of the period in mid-2023 to early 2024, when many institutional investors began to sell down their China exposures (mainly H shares) despite the strong fundamentals and valuation support in the A share markets. Perhaps it’s due to my long-standing conviction in EM/China equities, or perhaps it’s the unique position I have in being able to access both markets, this somewhat irrational behaviour has stayed in my mind ever since.
Since early 2024, the AH premium has been narrowing. This reflects not only the increasing integration between the mainland and Hong Kong markets, driven by enhanced capital flows and greater investor access, but also something less tangible: a shift in sentiment and perception. Still, with the index hovering around 130, A-shares continue to trade at an approximate 30% premium to their H-share counterparts.
What drives the widening or narrowing of the AH share premium?
At a conceptual level, the AH share premium reflects the market’s differential valuation of A-shares and H-shares, driven by a range of structural, behavioural, and institutional factors. To test this intuition, I conducted a regression analysis examining the relationship between changes in the AH premium and the divergence in price-to-earnings (PE) ratios of the broader A-share and H-share indices.
The results were striking: approximately 70% of the variation in the AH premium could be explained by the divergence in valuation trends between the two broader markets. This suggests that the premium is not primarily a function of differences in the fundamentals of individual dual-listed companies—which are generally consistent across markets—but rather a reflection of broader market sentiment and valuation dynamics in the A-share and H-share.

Drivers of broader market valuation and their impact on the AH share premium
The divergence in valuations between the broader A-share and H-share markets can stem from several macro- and micro-factors. While regulatory differences, domestic market events, and geopolitical tensions often contribute to this disparity, a natural question arises: can such valuation gaps be justified by differences in earnings potential or return on capital?
To further explore the underlying drivers of the AH share premium, I developed a model incorporating a range of explanatory variables:
- Currency exchange rate (RMB vs. HKD): Movements in exchange rates and expectations around RMB can influence relative asset pricing, thereby affecting the valuation differential between A- and H-shares.
- Economic Policy Uncertainty in China: The A-share market, dominated by retail investors, is more sensitive to policy changes, sentiment shifts, and speculative behaviour. In contrast, the H-share market is largely driven by institutional investors, making it more responsive to fundamentals. This behavioural divergence plays a key role in shaping relative valuations.
- Liquidity Differences: A-shares typically have higher trading volumes and larger local investor participation. As a result, A-share valuations may embed a liquidity premium, with investors willing to pay more for assets that are perceived as easier to trade.
- Company Fundamentals (EPS and ROE): Differences in earnings per share (EPS) and return on equity (ROE) between A- and H-share listings can also influence valuation. In such cases, the AH premium may reflect genuine fundamental discrepancies rather than purely sentiment-driven distortions.
Model Specification
Dependent variable:
HSAHP Index – Hang Seng Stock Connect China AH Premium Index
Independent variables:
- HKDCNY BGN Curncy: HKDCNY Spot Exchange Rate – Price of 1 HKD in CNY
- EPUCCHTB Index: China Economic Policy Uncertainty Index in Mainland Newspapers
- Liquidity Gap: The divergence in trading volume trends between A-shares (proxied by the Shanghai Stock Exchange A-share market) and H-shares (proxied by the Hang Seng Index), reflecting differential investor participation and market depth.
- ROE GAP: The difference in return on equity trends between A- and H-share markets, representing cross-market capital efficiency.
- Earning Gap: The divergence in earnings per share trends between A-shares and H-shares, capturing differences in reported profitability.
Results
The regression results indicate that liquidity differences and economic policy uncertainty in China are the most significant drivers of the AH share premium. In contrast, fundamental variables such as the ROE Gap and Earnings Gap showed limited explanatory power, and the exchange rate had a marginal impact.

Final thoughts
Despite increasing connectivity between the mainland and Hong Kong equity markets, most investors remain constrained by capital controls, regulatory barriers, and limited cross-border access, which inhibit full arbitrage capability between A-shares and H-shares. These frictions allow the AH share premium to persist, even in the face of fundamental alignment.
For those with the capacity to operate across both markets, this raises a deeper question: Is the market rational yet?
Disclaimer:
The views and opinions expressed in this blog are solely my own and do not represent the views of my employer or any affiliated organisation. The content is for informational and educational purposes only and is based on publicly available data (including sources such as Bloomberg).
This blog does not constitute financial advice, investment recommendations, or an offer or solicitation to buy or sell any financial instrument. No part of this content should be considered a financial promotion under the Financial Services and Markets Act 2000.
While care has been taken to ensure the accuracy of the information presented, I make no representations or warranties as to its completeness or accuracy and accept no liability for any errors or omissions. Please conduct your own research or consult a qualified professional before making any financial decisions.
Data Source: Bloomberg

Leave a comment